Last weekend's victory for New Zealand over Ireland was generally met with disappointment - not with the performance of those in an Irish jersey but that of referee, Jaco Peyper. Former Leinster and Ulster coach, Matt Williams was amongst those who believe referees are influenced by the All Blacks.
Speaking to the Irish Times Second Captains podcast;
You only have to look at Nigel Owens. Nigel is a fantastic referee, he refereed teams that I've coached for 10 years and I've got huge respect for him. He had a terrible game refereeing New Zealand against Australia in Eden Park.
He got things really wrong. The best in the game are intimidated by what New Zealand will say about them post-match. They have buried people's careers and they have survived other people's careers. It is a very big flaw in our game that they can get away with this.
Williams continued by citing statistics to support claims of referee bias in favour of New Zealand.
I haven't got the exact stats but I know, I said on this programme a few years ago: for every 11 penalties, South Africa got a yellow card; for every 12 penalties, Australia got a yellow card. For New Zealand, this was around two years ago, three years ago between the [World] Cups. For every 43 penalties against New Zealand, there was a yellow card.
There's absolutely no doubt that New Zealand are being refereed differently.
The Results
So, while Matt doesn't claim the statistics are up to date, and penalty count to yellow card ratio is far from the only way to judge refereeing favouritism, it is worth noting that recent games suggest the opposite is true when it comes to that particular ratio.
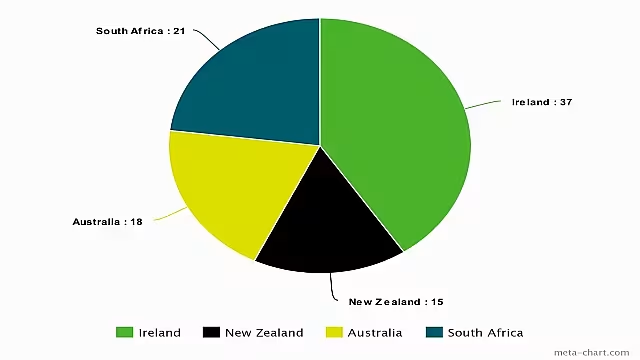
We've had a look at how New Zealand, Australia, South Africa and Ireland fare when it comes to yellow card to penalty ratio. The results in focus are from the beginning of the Rugby World Cup in September 2015 until present.
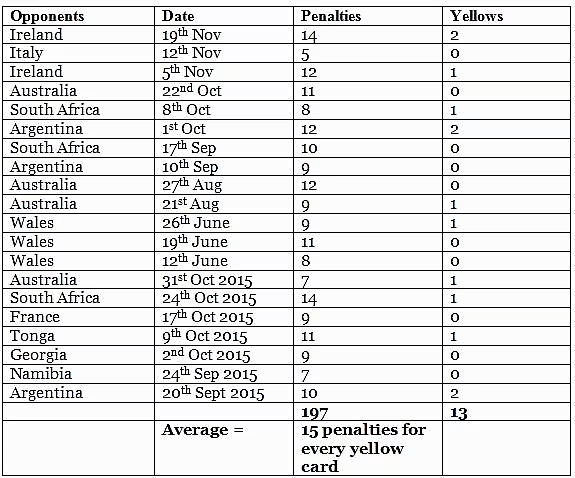
New Zealand Results 20th Sep 2015 - 19th Nov 2016

Rather remarkably, New Zealand have received a yellow card for every 15 penalties they concede - which is quite some way off the 43 as Matt Williams claimed. That's not to dispute his statistics from a few years ago, but it is interesting to note that in recent years - specifically the past twelve months - referees have not been as lenient as first believed.
In comparison, Australia, Matt's home country, have averaged a sin-binning for every 18 penalty offences. Meanwhile, South Africa were punished with a yellow card for every 21 penalties conceded in this time frame, (Though it should be noted they have played less games than the two aforementioned teams.)
And now the real kicker....
Ireland are by far the least carded of the four teams, averaging a yellow every 37 penalties since the start of the Rugby World Cup - having picked up only four yellow cards in 16 games.

To reiterate, these statistics only tell part of the story when it comes to how a referee officiates the game. For example, if an infringement is missed by the referee or not deemed an offence, the penalty count would be lower to begin with. But considering the point that Matt Williams made about the penalty to yellow card ratio, it is important to point out that the opposite appears to be true, at least in the last 12 months.
All statistics are provided by ESPN.Co.UK.


