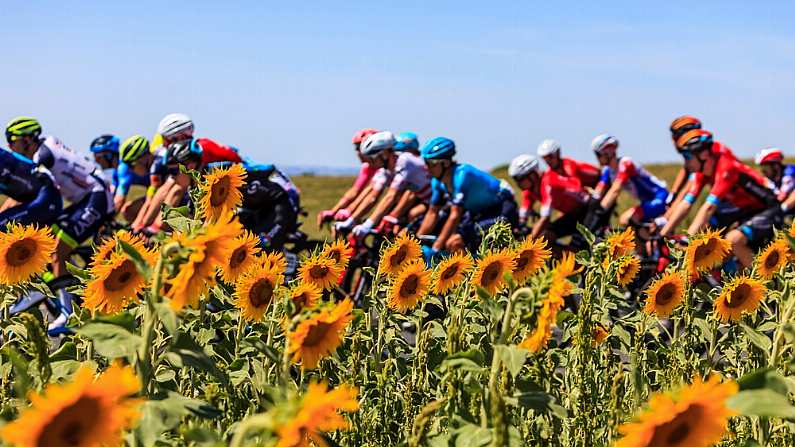
11,000 people will be cycling in the baking heat around Kerry this weekend as part of the Ring of Kerry Charity Cycle. And participant and infographic designer Aimee Stewart is looking to pool everyone's data together to create the first ever infographic of a cycling event in Ireland.
The infographic will help us break down the Ring of Kerry cycle in real depth. What's the toughest climb? What's the fastest segment? Taken together, how high did the field climb collectively? What percentage of people walk rather than cycle up Moll's Gap?
If you're embarking on the cycle this weekend, send on your Garmin/Strava/Map my Ride data to Aimee to help in the creation of this potentially powerful and informative infographic. Just visit Infographic natives here to submit your data. The records will anonymous.
Visualising data can really make plain insights and patterns and clearly illustrate them for a wider audience. This way, future Kerry Cycle participants will know what they're facing...


